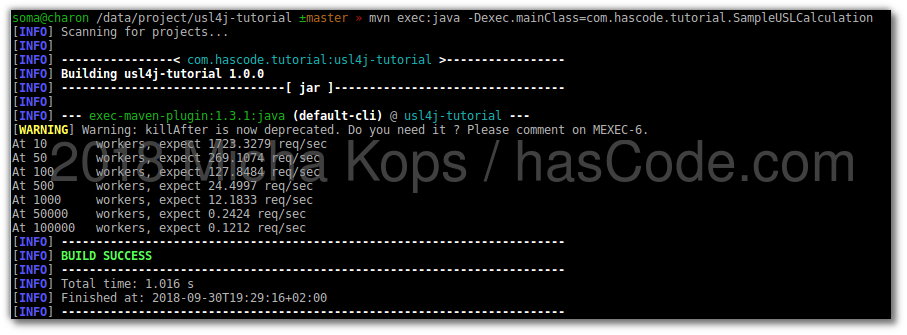
Capacity Planning using the Universal Scalability Law with Java and usl4j

Capacity planning is an important task when trying to anticipate resources and scaling factors for our applications. The usl4j library offers us an easy abstraction for Neil J. Gunther’s Universal Scalability Law and allows us to build up a predictive model based on the parameters throughput, latency and concurrent operations. With a basic input set of two of these parameters, we are able to predict how these values change if we change one input parameter so that we can build our infrastructure or systems according to our SLAs. ...
September 30, 2018 · 6 min · 1070 words · Micha Kops

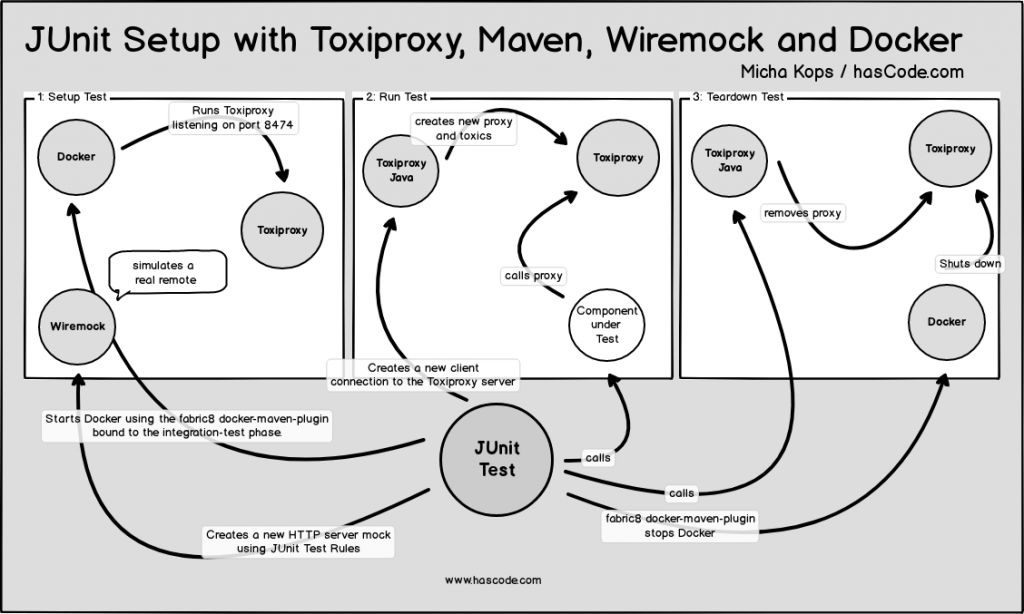
Testing Java Applications for Resilience by Simulating Network Problems with Toxiproxy, JUnit and the Docker Maven Plugin

When implementing distributed systems, client-server architectures and simple applications with network related functionalities, everything is fine when we’re in the development or in the testing stage because the network is reliable and the communicating systems are not as stressed as they are in production. But to sleep well we want to validate how resilient we have implemented our systems, how they behave when the network fails, the latency rises, the bandwidth is limited, connections time out and so on. ...

July 29, 2018 · 9 min · 1836 words · Micha Kops

Observability Snippets

Observability Strategies USE USE stands for: Utilization - Percent time the resource is busy, such as node CPU usage Saturation - Amount of work a resource has to do, often queue length or node load Errors - Count of error events This method is best for hardware resources in infrastructure, such as CPU, memory, and network devices. For more information, refer to The USE Method. Source: https://grafana.com/docs/grafana/latest/dashboards/build-dashboards/best-practices/ RED RED stands for: Rate - Requests per second Errors - Number of requests that are failing Duration - Amount of time these requests take, distribution of latency measurements This method is most applicable to services, especially a microservices environment. For each of your services, instrument the code to expose these metrics for each component. RED dashboards are good for alerting and SLAs. A well-designed RED dashboard is a proxy for user experience. ...

March 1, 2010 · 2 min · 231 words · Micha Kops